
這次的題目會介紹如何使用Keras和Boston Housing建立一個Linear Regression Model,當中會重溫一些和機器學習相關的知識;
如果你沒有任何關於ML的知識,可以先看看我之前的幾編文章:
建立模型的流程
首先回顧一下建立機器學習模型,有那些步驟:
- 獲取數據
- 研究及整理數據
- 建立模型
- 調試及評估模型
以下製作模型的方法,也是根據這個流程的設計的。
編寫程序
編寫AI相關的程序,你可以有2個做法:
- 使用VSCode + python3
這個做法,首先安裝VScode,然後安裝python,安裝python後,使用pip 安裝
以下ML相關的Libraries.
pip3 install tf
pip3 install matplotlib
pip3 install pandas
然後,在 VSCode 編寫你的代碼,例如: tensorflow_linear_reg.py
然後,在Terminal,使用以下指令運行:
python3 tensorflow_linear_reg.py
- 使用Google Colab 或 Juyther notebook
由於Google Colab 的notebook,他本身已安排了以的ML Library,就不用額外再安裝了。這個做法安裝會比較方便,但是由於Google 分配給你的CPU Power不會太多,所以會比較慢
本教學會以Google Colab進行教學。
建立Google Colab Notebook
首先註冊/登入 Google Drive,建立一個學習機器學習的Folder,例如 /ml-tutorials/

使用“新增 -> 更多 -> Google Colaboray" ,使用後,你會看到這個畫面:
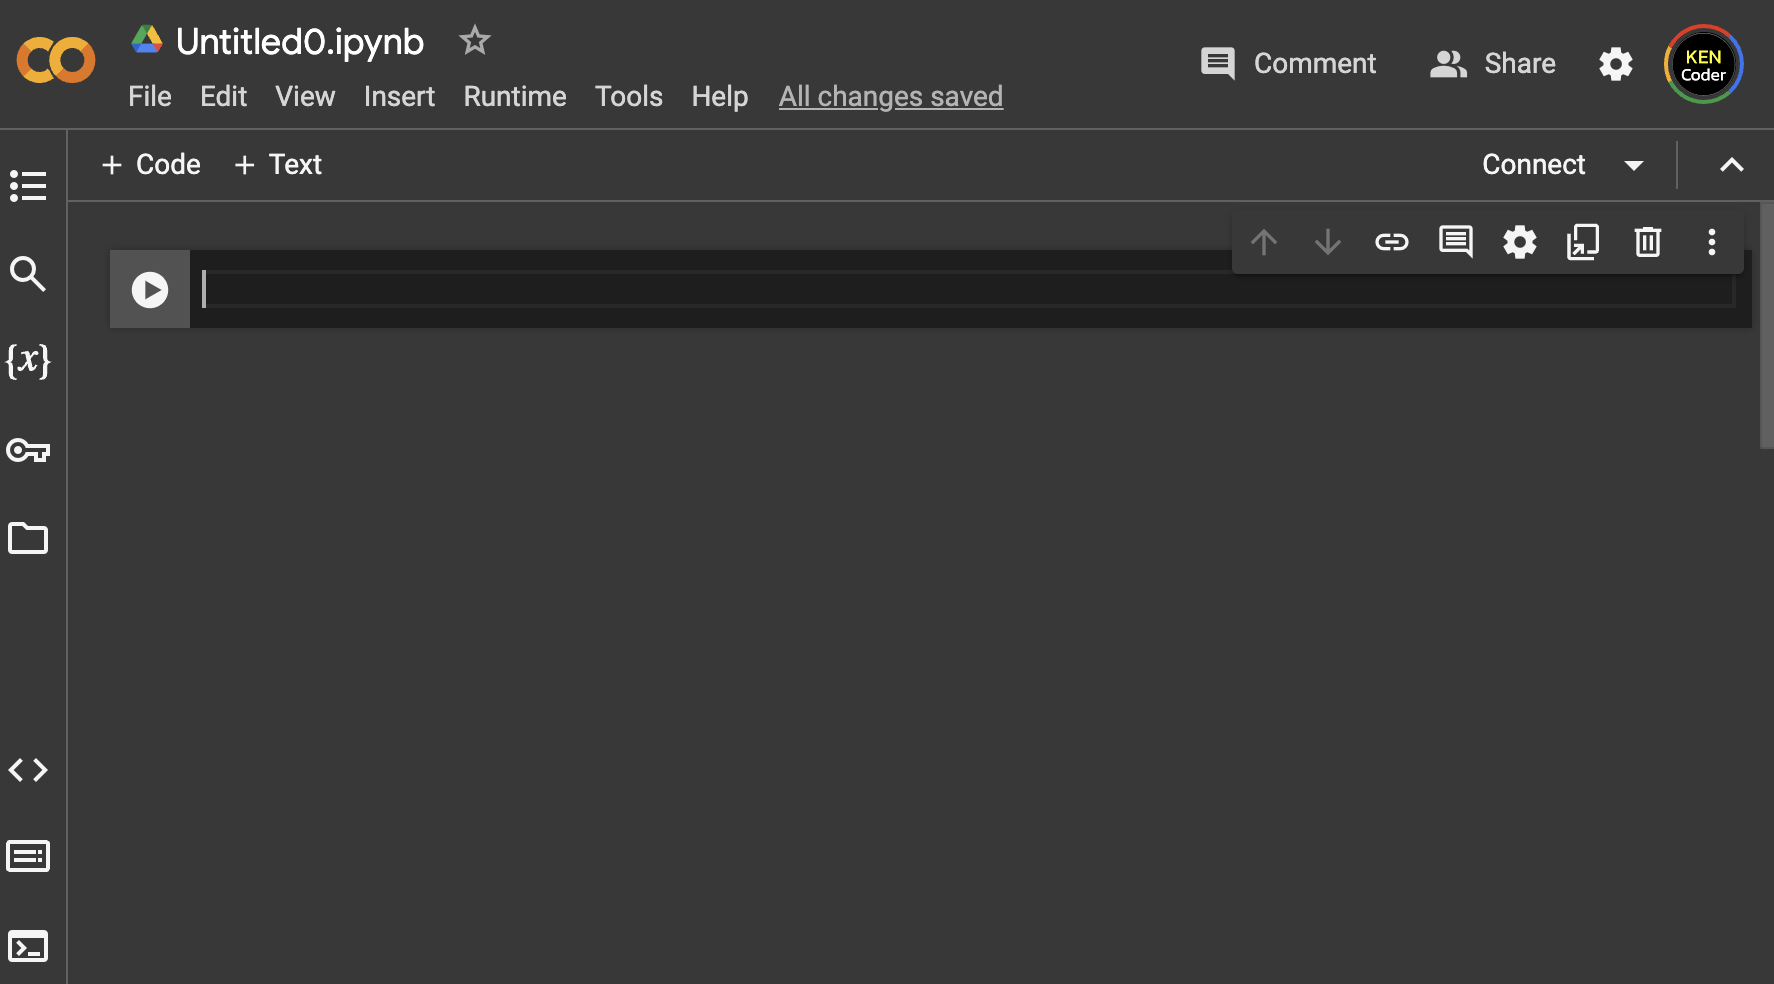
點 “Untitled0.ipynb"位置,然後修改為 tf-study-boston-housing.ipynb
如果想了解Google Colab的使用方法,可以參考以下的資訊:
匯入Library
第一部分,就是匯入Library,Library雖然可以在notebook中間加入,但是,在頭部加入,可以避免搬動代碼後,出現編譯錯誤。
代碼內容:
import tensorflow as tf
import matplotlib.pyplot as plt
import pandas as pd
獲取數據
機器學習的第一步,就是需要獲取數據,在Tensorflow中,本身提供了很多數據,詳細可以參考這個網站:
你會使用boston housing數據作為這次project測試的對象,這是數值數據內容,用來製作Linear Regression 模型;
相關獲取數據的代碼如下:
(train_data, train_targets), (test_data, test_targets) = tf.keras.datasets.boston_housing.load_data(
    path="boston_housing.npz", test_split=0.2, seed=113
)
這是使用Keras預先提供的Dataset,作為學習來說很方便;
當然,實際工作就需要懂得如何從.csv 或其他方法獲取數據給你進行研究和訓練模型,之後的文章會說明相關的操作(預告)。
研究及整理數據
獲取後,下一步就是研究數據,這個是很重要的步驟,一般來說需要了解清楚數據,才能知道怎樣做機器學習或是否能做到。
可以使用以下代碼,簡單了解數據的簡單的資料:
print("Data Information")
print("Training Shape: data=", train_data.shape, " targets=",  train_targets)
print("Testing Shape: data=", test_data.shape, " targets=", test_targets)

number_of_features = train_data.shape[1]
number_of_training_samples = train_data.shape[0]
number_of_testing_samples = test_data.shape[0]
mean_of_training_target = train_targets.mean()
mean_of_testing_target = test_targets.mean()

print("Number of Features: ", number_of_features)
print("Number of Training Samples: ", number_of_training_samples)
print("Number of Testing Samples: ", number_of_testing_samples)
print("Mean of Training Target: ", mean_of_training_target)
print("Mean of Testing Target: ", mean_of_testing_target)
建立supervised learning模型前,需要準備數據,並且了解哪些是輸入數據(X),那些是輸出數據(y),和這些數據存在嗎?
如我們的例子:
輸入:train_data, test_data
輸出:train_targets, test_targets
上面的代碼,就是可以讓你知道數據的Shape,也是等於知道有多少項資料,和多少Features。當然這次也計算了數據的平均值(mean),這個數值會用在之後計算錯誤率(Error Rate)上;
如果想了解數據內容,夜可以使用Panda 的Dataframe 來查看
train_data_df = pd.DataFrame(train_data, columns=["CRIM", "ZN", "INDUS", "CHAS", "NOX", "RM", "AGE", "DIS", "RAD", "TAX", "PTRATIO", "B", "LSTAT"])
train_data_df.head()
train_targets_df = pd.DataFrame(train_targets, columns=["Target"])
train_targets_df.head()
建立模型
使用Keras建立模型有3部曲:結構、編譯 (compile)、訓練(fit);
相關代碼如下:
# model setup
# Set random seed
tf.random.set_seed(42)

# Define the model
model_1 = tf.keras.Sequential([
    tf.keras.layers.Dense(20, input_shape=(13, )),
    tf.keras.layers.Dense(10),
    tf.keras.layers.Dense(1) # 1 unit (important for output layer)
])
由於數據有13個features,所有 input_shape是 (13,),
由於輸出數據一定1個feature,所以 output layer 是1個Node.
# model compile
model_1.compile(loss=tf.keras.losses.mae,                optimizer=tf.keras.optimizers.legacy.Adam(learning_rate=0.001),
                        metrics=['mae'])
- 使用MAE (Mean Absolute Error)來所錯誤評估 (Loss Calculation),和用了Adam做Optimizer,而他提供了learning rate 選項,
# model training (fitting)
history = model_1.fit(train_data, train_targets, epochs=50)
如果想了解training的情況,可以使用以下代碼來查看:
model_1.summary()
pd.DataFrame(history.history).plot()
plt.show()
使用pd.DataFrame(history.history).plot()就可以看到Loss(MAE)如何變化/改善。

調試及評估模型
”建立模型“不是最後一個步驟,你還不能直接拿去使用,你還需要檢查一下模型的表現;
以下是tensor提供的模型評估代碼:
print("Fast Evaluation")
model_1.evaluate(test_data, test_targets)
執行後,你會看到這個結果:
Fast Evaluation
4/4 [==============================] - 0s 13ms/step - loss: 5.5726 - mae: 5.5726
[5.57256555557251, 5.57256555557251]
你會知道loss/MAE的數據,但是5.572這數字是否夠好呢??
那麼誤差率又是什麼??
Loss在這個情節下的意思是,估算的價錢和實際價錢是USD5.57;
如果樓價是大概10USD ,那麼這個誤差是大概 (5.57/10 * 100)% = 56%左右
但是如何樓價是10000USD,那麼誤差就0.00056%,十分小。
那麼樓價是什麼?
我們可以使用Test Targets數據,計算他的mean來使用;
其實用全部Data Sample也可以;
除了Mean,你可以使用Min / Max,這樣你可以錯誤率的範圍;
錯誤率的計算的公式為:loss / mean * 100;
而相關代碼是:
print("Calculate Mean Absolute Error")
predict_targets = model_1.predict(test_data)
predict_targets = predict_targets.squeeze()

mae_metrics = tf.metrics.mean_absolute_error(
    y_true=test_targets ,
    y_pred=predict_targets)
print("mae_metrics: ", mae_metrics.numpy())

error_percentage = (mae_metrics.numpy() / mean_of_testing_target) * 100

print("Error Percentage: ", error_percentage)
假如太過50%,其實和隨機沒有分別了。假如太過10%,很多項目應該應用不了。
如果你想需要優化模型,減少這個錯誤,可以做以下事情:
- 改變 Learning Rate
- 增加 Epochs 數量
- 增加Neural Network的Layer
- 增加Layer的不同Layer的 Node
- 使用其他Algorithm
基本上,1 – 4 可以幫助你進行少量優化,如果需要大幅優化,就需要選擇更適合的Algorithm,或者研究一些新方法.eg 之後會提及的CNN。
總結
完整代碼,可以在我的Google Colab 看到:
https://colab.research.google.com/drive/1oLTTfgtCs1JfCW5p9IJHpGhR4muvfYmw?usp=sharing
而完成這篇文章,你應該可以做到以下事情
- 讀取Keras的Sample Dataset
- 建立及訓練模型
- 評估模型及計算錯誤率
最後,大家如有問題,可以歡迎透過Facebook和Twitter直接問我的;
另外,請加入我的FB專頁,有新文章發布時,大家就能立即知道了。
Facebook 專頁連結:https://www.facebook.com/kencoder1024
Twitter連結:https://twitter.com/kenlakoo

發表留言